A Data Exploration App
November 2018
What does the app do?
This is a web application built with Shiny and R and designed to aid exploration of large datasets. With the example data provided you can view the music streaming habits of two users. Data for the two users is provided with the dataset IDs ‘eg01’ and ‘eg02’. Using the app you can see in which months they listened to which genres of music. You can also dive down to the individual months and days for more detail.
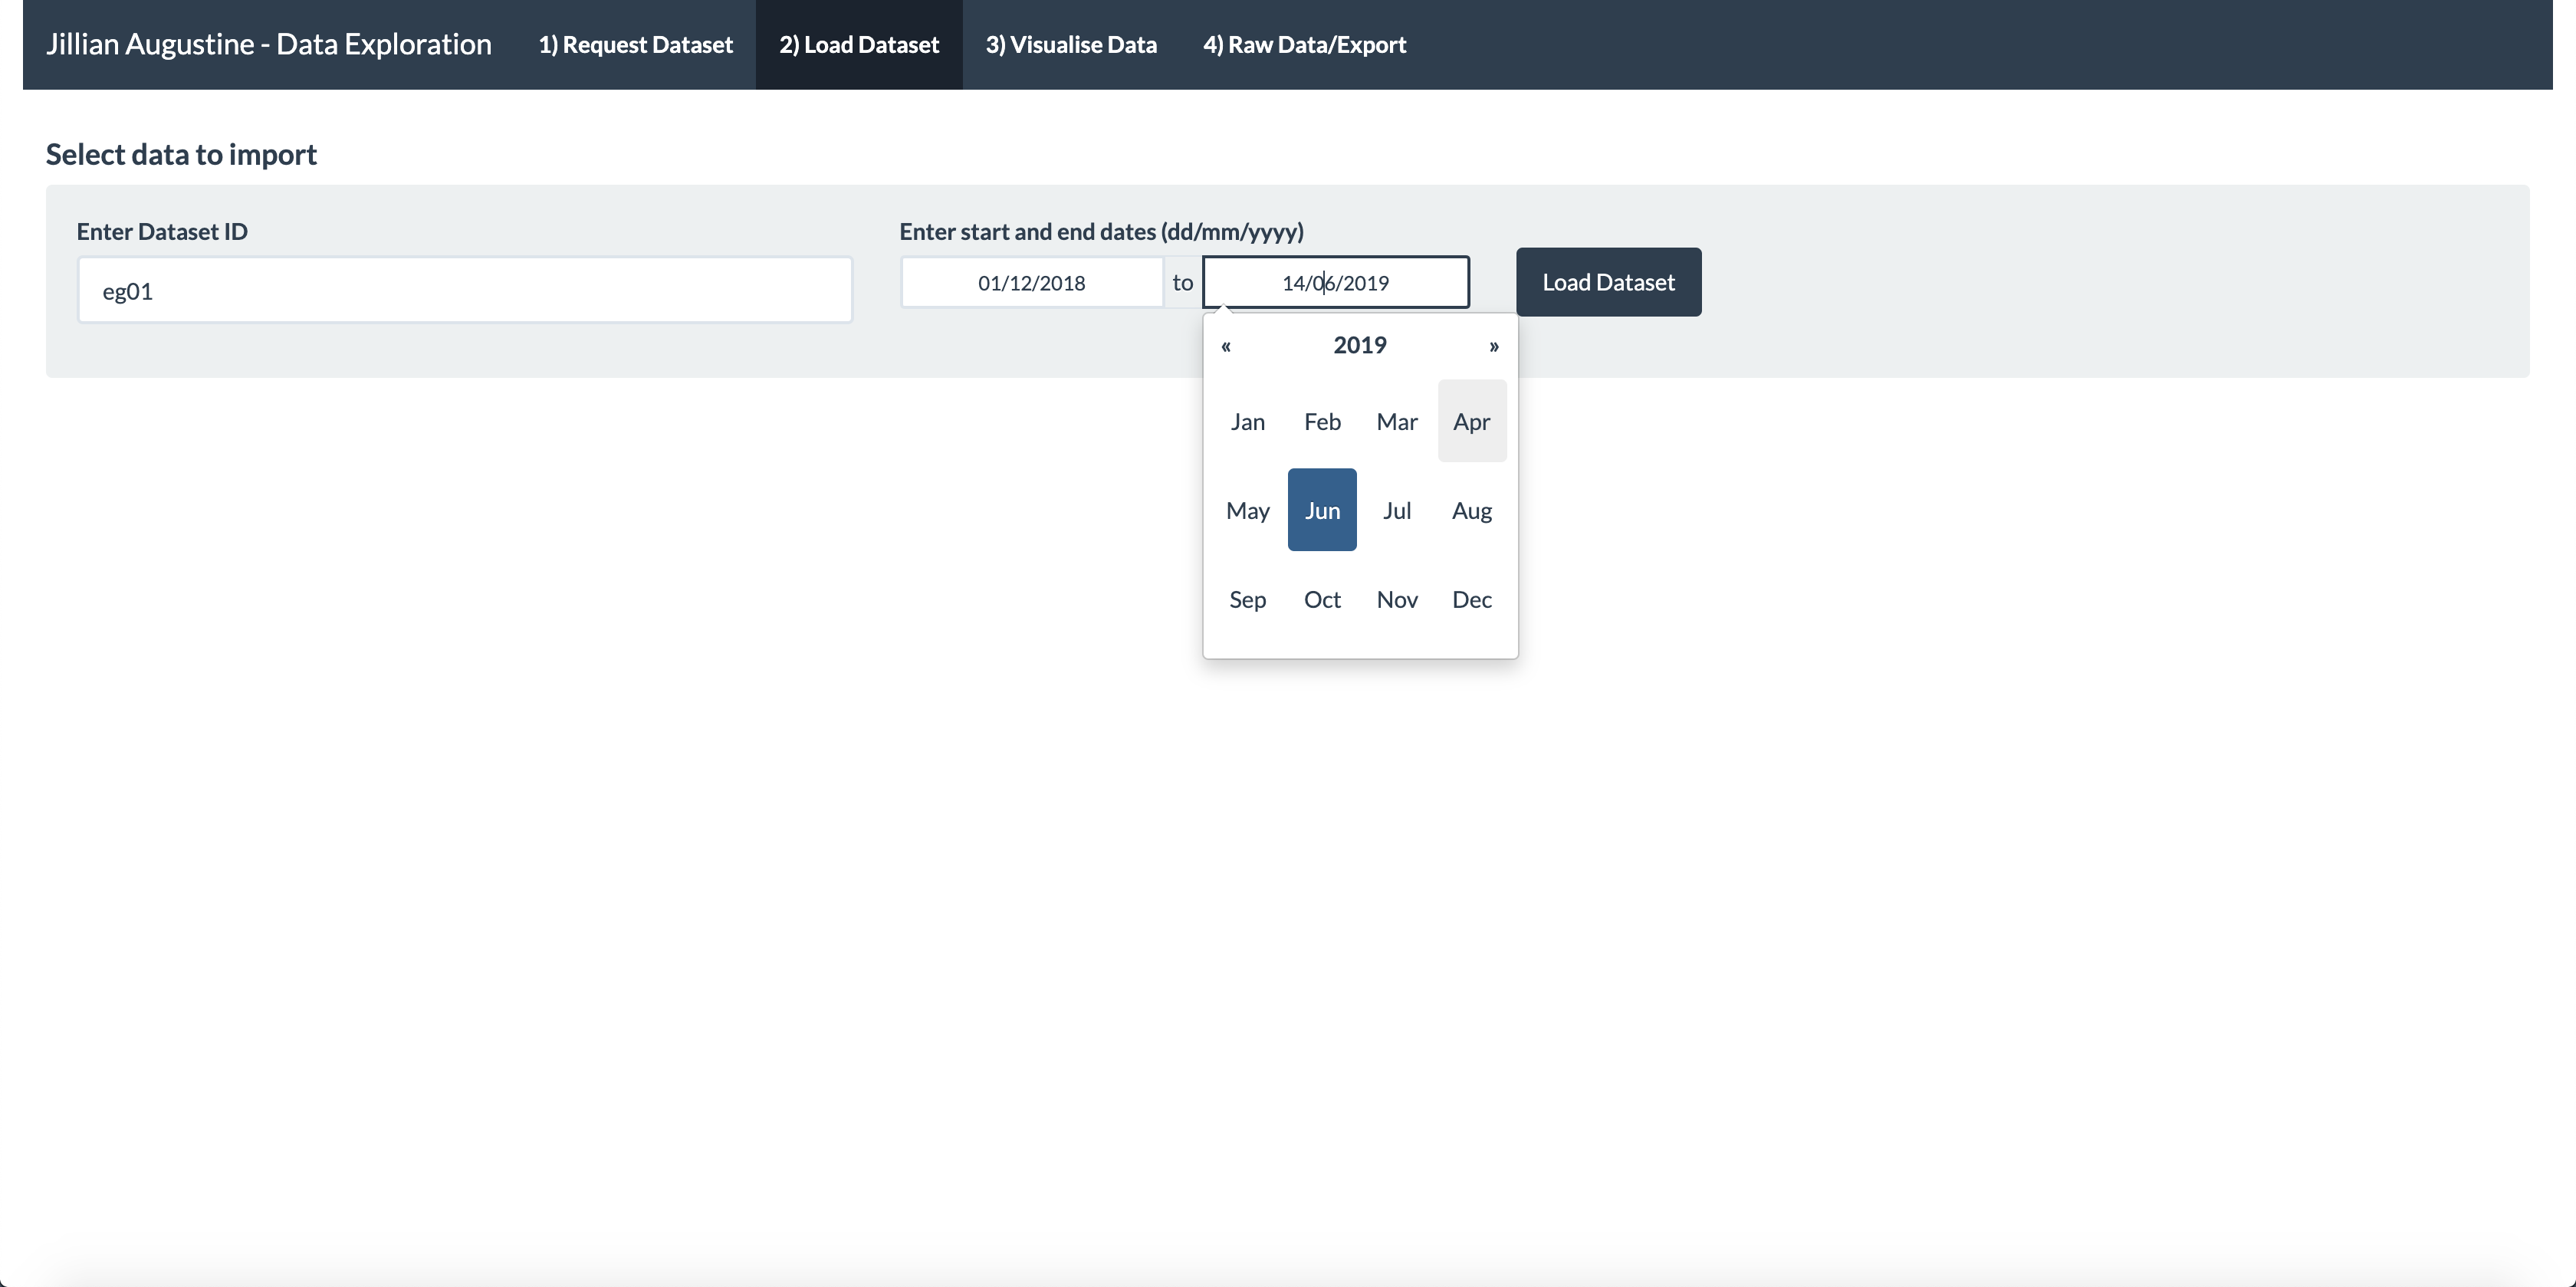
Data can be loaded by providing a dataset ID number and a date range.
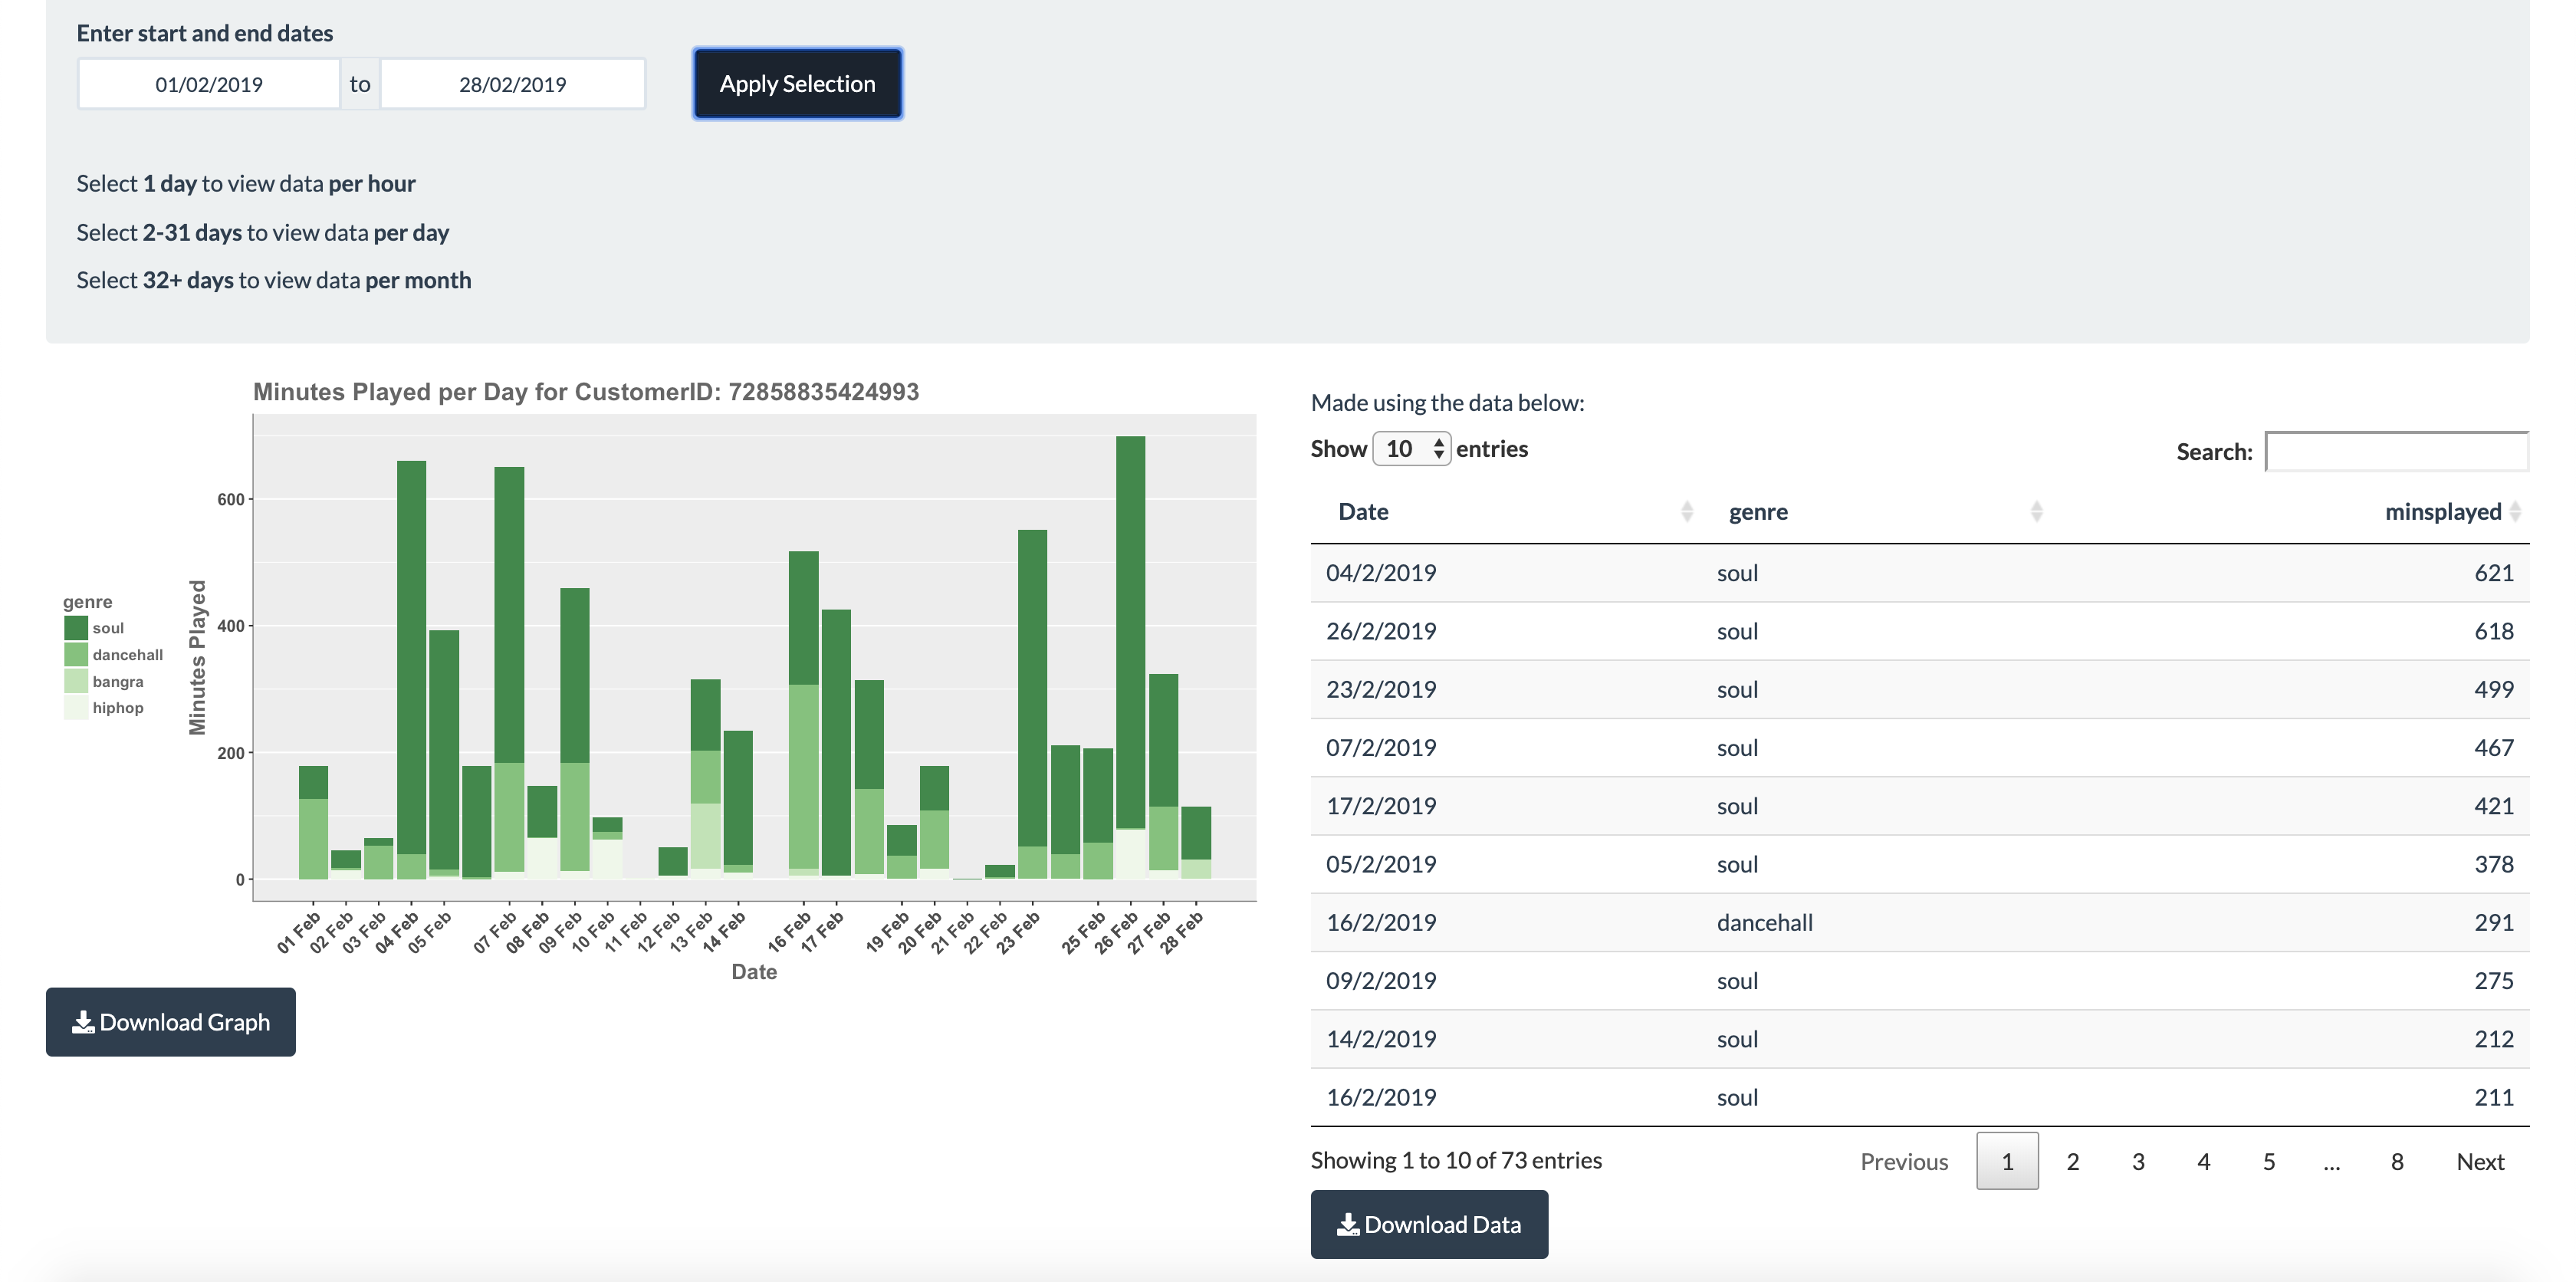
Visualising customer data per day in graphical and tabular form.
Behind the web app is a data pipeline which, upon pressing a button in the app, starts a Spark job. This job generates and runs SQL queries on a database. It then saves the results of the queries as parquets, and merges and repartitions the parquets to optimise performance. After checking for errors, it automatically sends emails a unique dataset ID to the person who requested the data. Using this ID the user can reenter the app to view the data. Finally the cleans up the disk space removing any temporary files created.
The app also contains logging functionality. Everytime data is requested or viewed using the app, a record is added to the relevant log (logs_req.txt and logs_read.txt). This way, activity of the app can be tracked. While most of the files in the app can be read only, users of the app must have permission to write to this file.
Whom is the app for?
This web application is designed for anyone who wants to have a summarised look at large amounts of data with the help of classic data visualisations. This app is also useful for users who prefer to work with spreadsheets because the raw data are also exportable as a ;-delimited file.
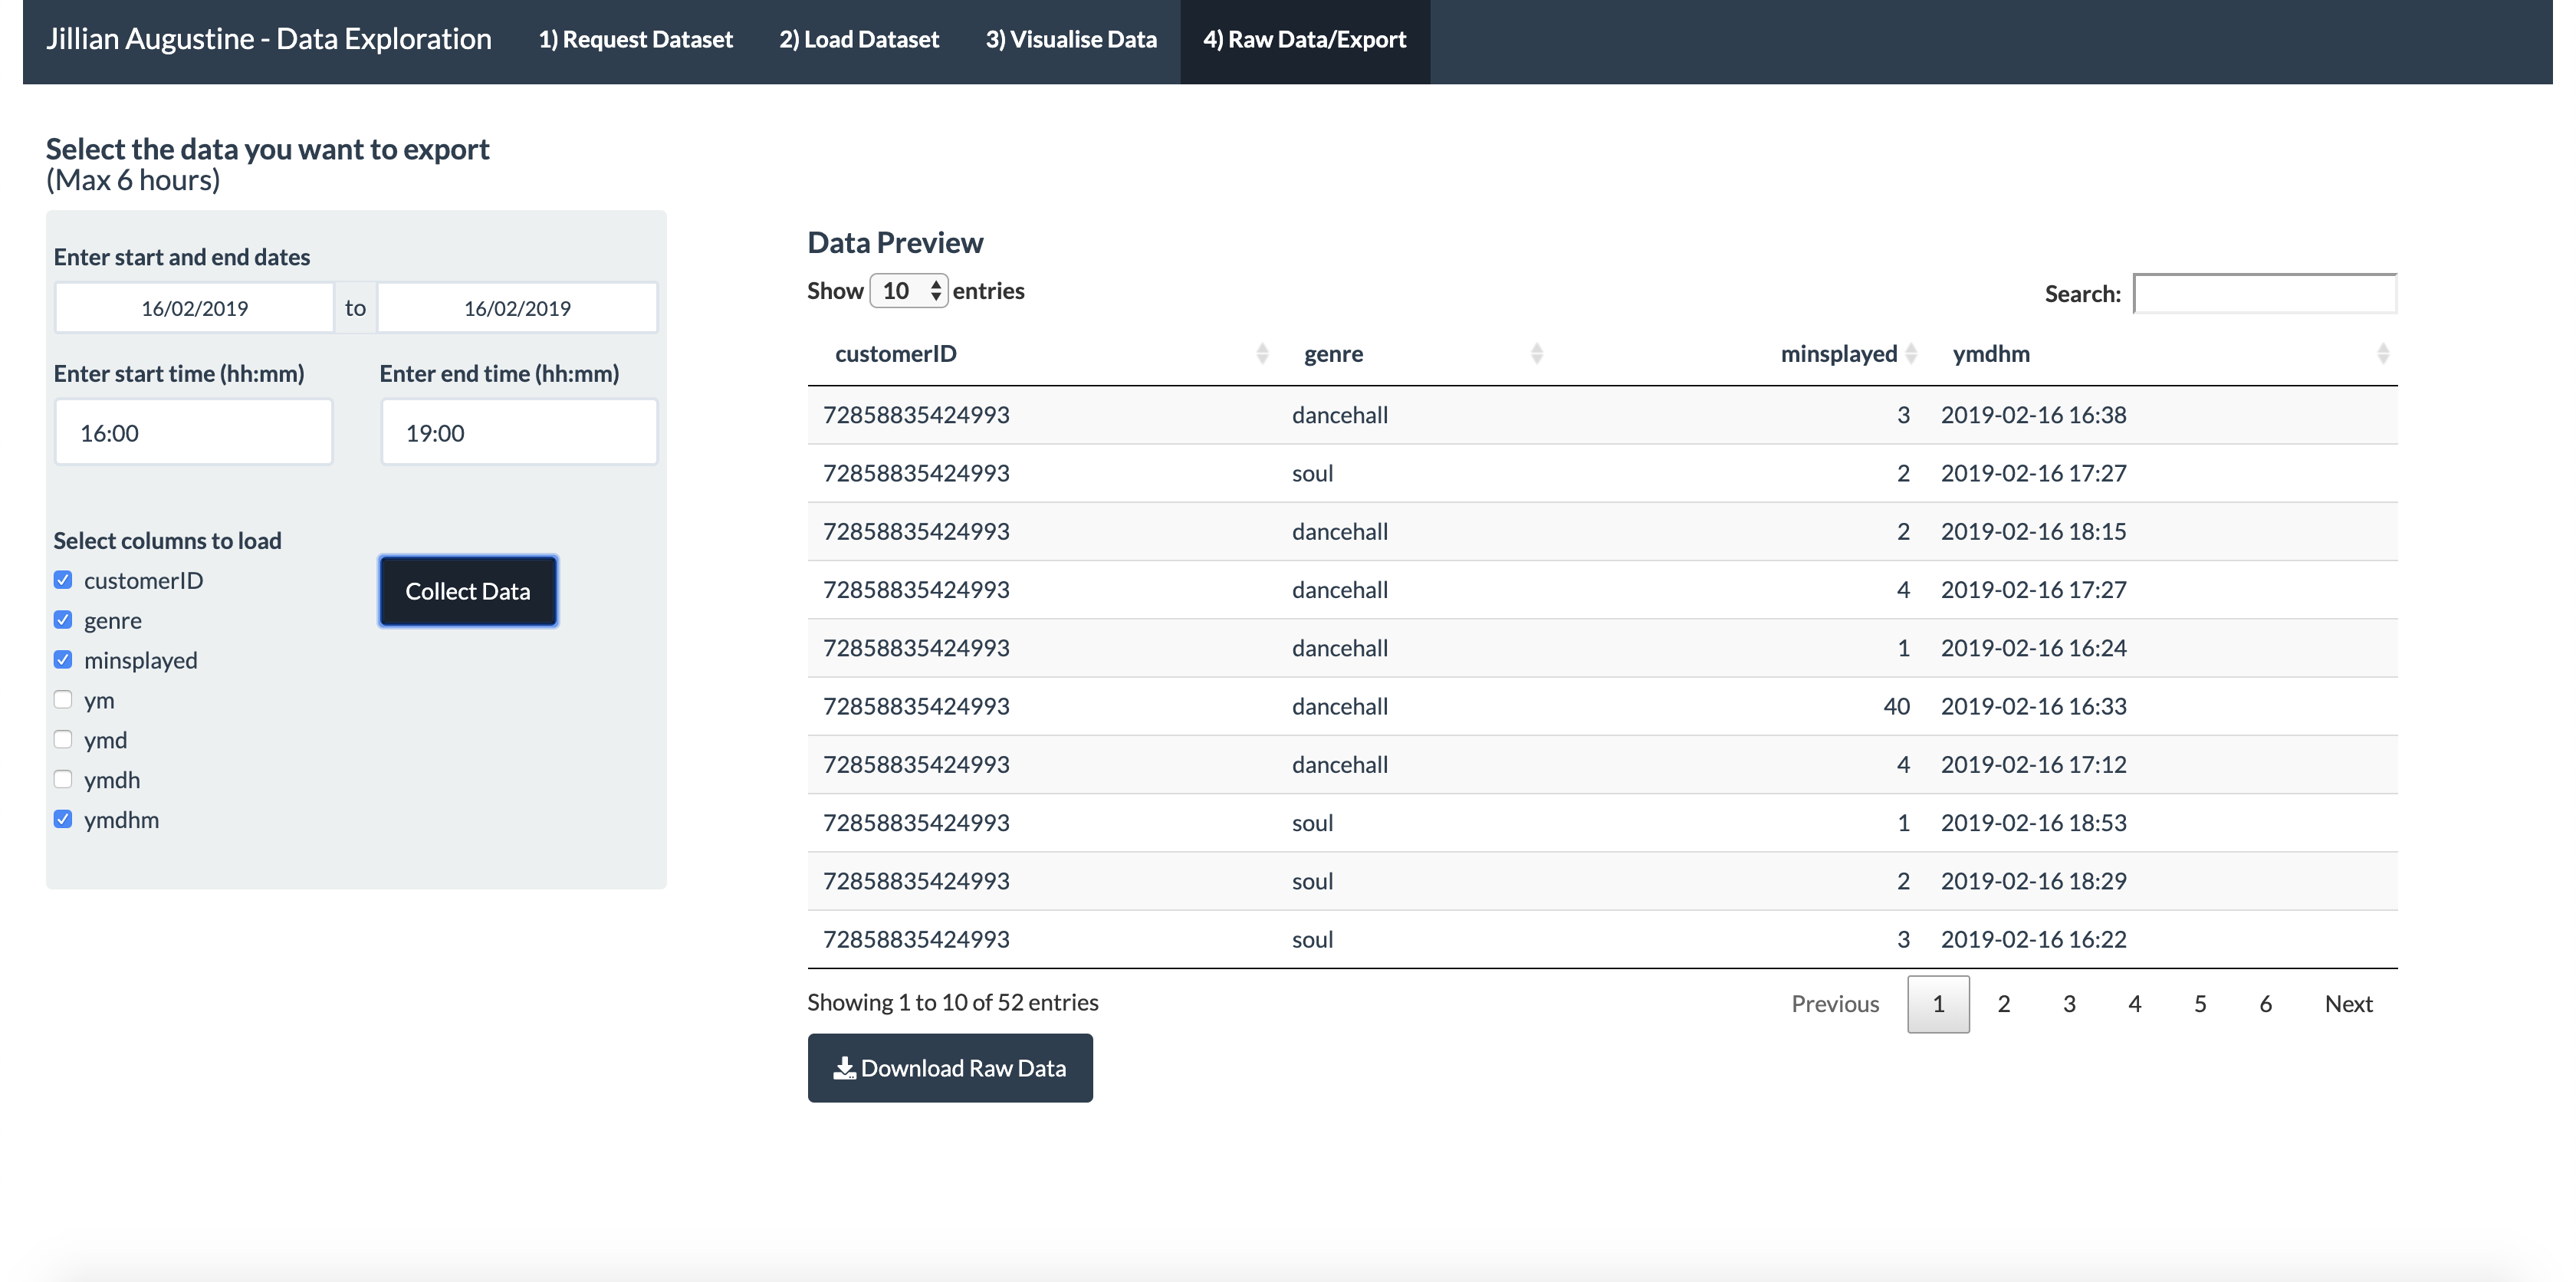
Checkboxes are used to select which columns of data to load. This data can then be exported for use, for example, in Microsoft Excel.
Where does this app run?
If you clone the github repository you will also have a copy of the two example datasets. You can then run the app on your local machine from RStudio using the command shiny::runApp("path_to_dataEx_app_split_folder", launch.browser = TRUE).
The app was designed to be connected to a hadoop distributed file system (HDFS) and spark session.
How long did this take?
This app took me 4 months working on and off. I initially made a prototype which looked quite different. I then asked for and incorporated feedback which resulted in the app in it’s current form. It was my first Shiny Web Application and I am very happy with the functionality of it.
Why create the app?
We often collect very large amounts of data that cannot be understood simply by looking at them. It helps to summarise theme data in the form of visualisations. Moreover, in cases where we have many customers or some other kind of category, it helps to be able to create individual reports.
Why interactive? Too much data can be overwhelming. It’s much better to allow the end users to decide exactly what they want to visualise/export.
How was it made?
I chose Shiny to build this app because it seemed realtively simple to start to use (compared to other app making tools). I found the documentation and tutorials about Shiny very clear. Furthermore, I liked the range of themes to select from which meant I did not have to personalise all aspects of the user interface.
More Information
The code for this app can be found in the GitHub Repository.